Gym Geek's United States Protein Consumption Index indicates how much protein is consumed in the typical US diet, as a percentage of total calorie intake. This data is based on anonymized search data from the Gym Geek calorie tracker mobile app.
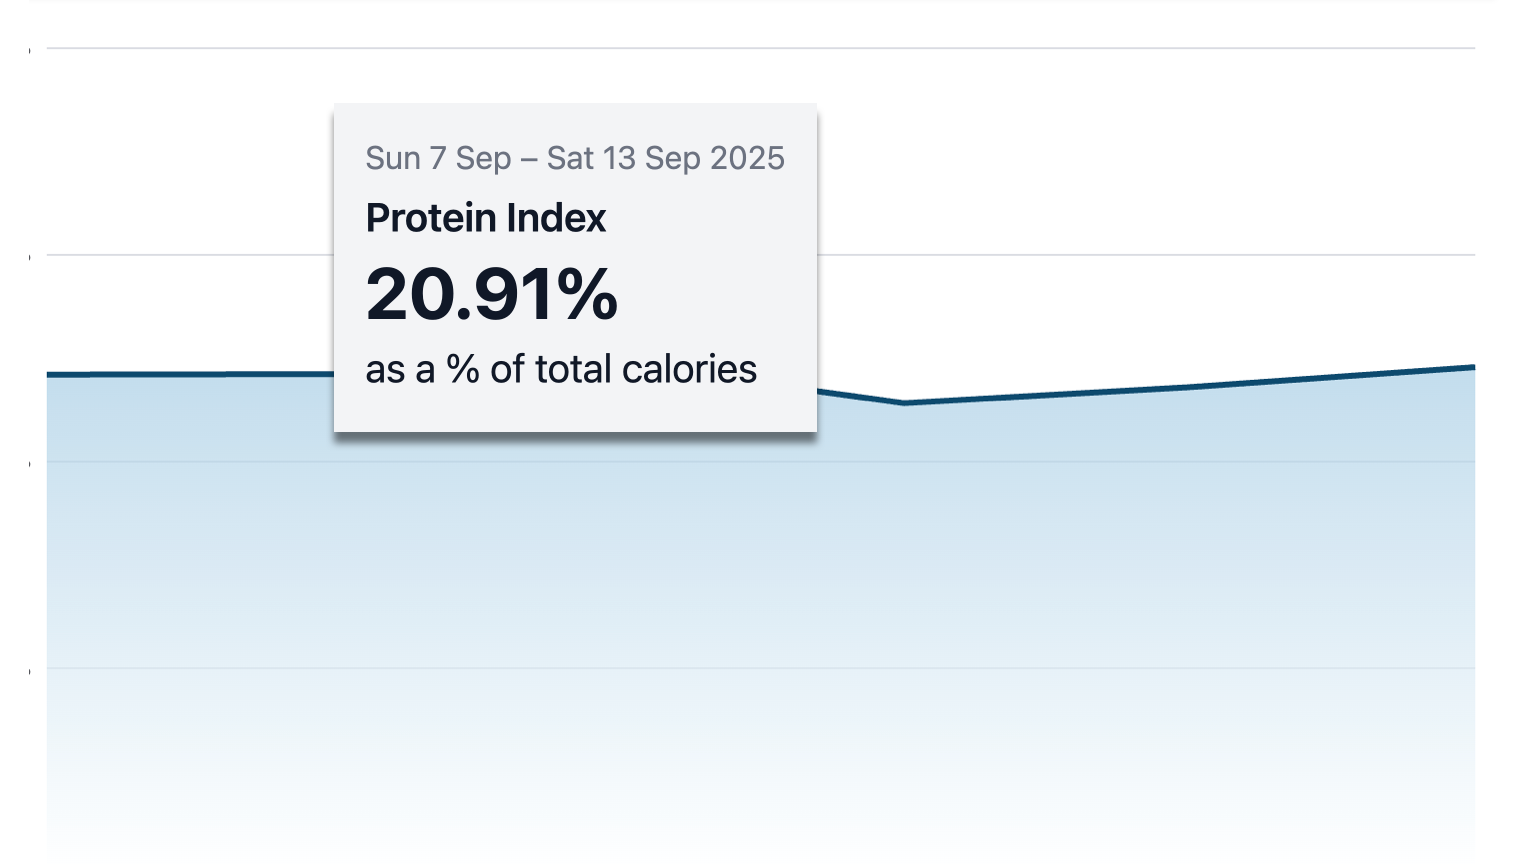
Because our app users pay extra attention to their diet, our protein intake index may be higher than the typical American diet. The CDC estimates a mean protein intake of 16.0% men and 15.7% for women, while Gym Geek users in aggregate consume 20.9% protein a % of total calorie intake (estimate as of 13 Sep 2025).
The Protein Index is updated weekly.
Methodology
Gym Geek takes user privacy seriously. Because we do not store users' tracked calorie data, our Protein Index is not based on the foods or meals that users track in our mobile app. Instead, our index is calculated indirectly based on anonymized search data.
Matching queries with USDA calorie data
For our index, Gym Geek uses standardized nutrition data provided by the USDA National Nutrient Database for Standard Reference (Legacy). This database contains protein, fat and carbohydrate data for all categories of food, including fruits and vegetables, meat products, dairy and egg products and beverages. It also includes a limited number of branded products.
For each search query entered into the Gym Geek mobile app, we find the closest matching entry in the USDA food database using a semantic search method. Specifically, we calculate a vector embedding for each incoming search query and match it against the closest embedding in the USDA database.
Calculating the index
For each item in the USDA database, we store a per-day count for the number of times the item was matched. For each week in our index, we add up the total number of calories originating from protein and divide it by the total number of calories originating from all nutrients.
Limitations
- The USDA database does not have full coverage of branded products or restaurant items. In this case, searched food items will match against the closest USDA item. This may introduce a bias since branded processed products are likely to be lower in protein.
- For each search query, we assume the standard portion size was consumed. This aligns with common serving sizes listed on food labels or represents typical portions found in restaurants and meals. Most Gym Geek users track the standard portion size for convenience, although this may introduce a bias if portion sizes are significantly different.
- The index does not include calories contributed by alcoholic food and drinks.